Project Page
The project view page shows all information for a specific project.
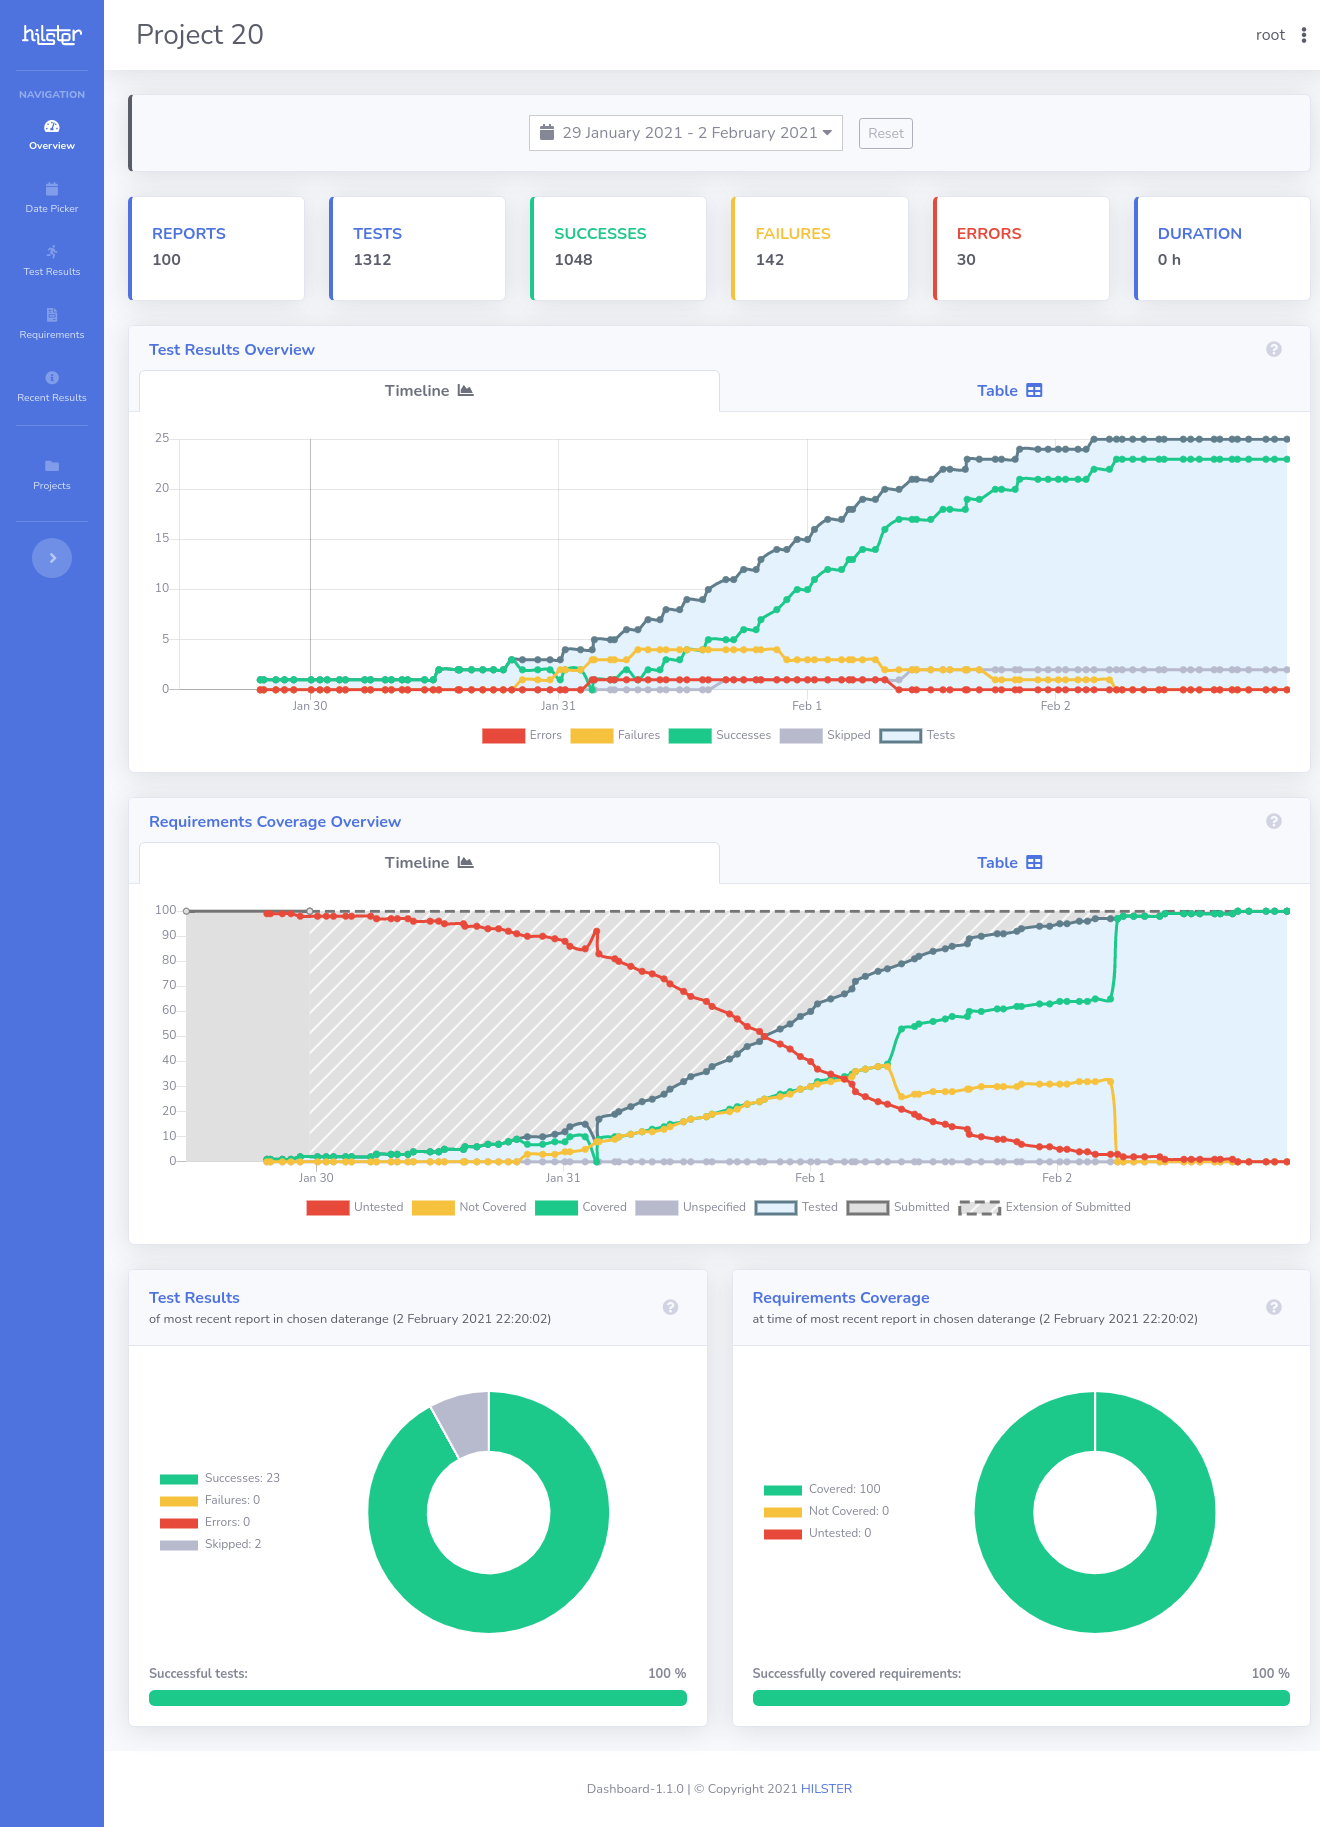
Project view
Datepicker
You can select the visible date range using the datepicker by clicking on it. The project page reloads automatically and show the desired results within the selected date range.

Datepicker
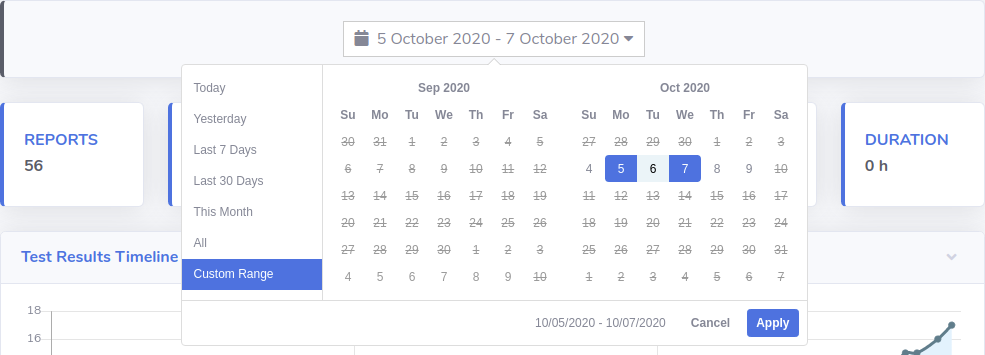
Expanded Datepicker
Statistics
The statistics callouts contain important statistics about the project.
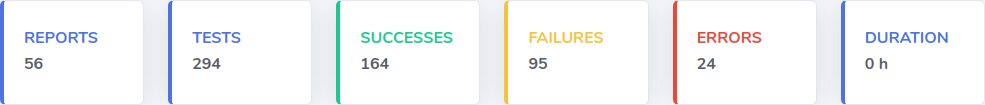
Statistic Callouts
Test Results
The Dashboard tracks test results and generates meaningful charts.
Test Results Timeline
The test results timeline shows the submitted test results over the time.
The chart contains successful, failed, defective and skipped tests as well as the total number of tests.
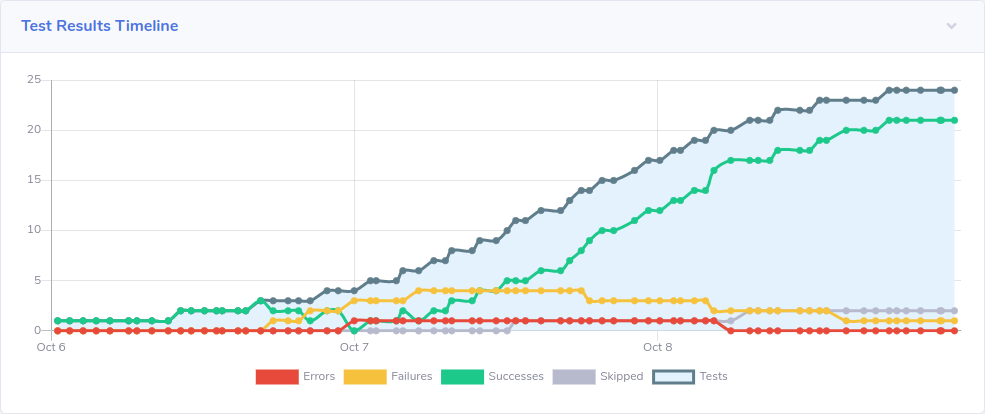
Test Results Timeline
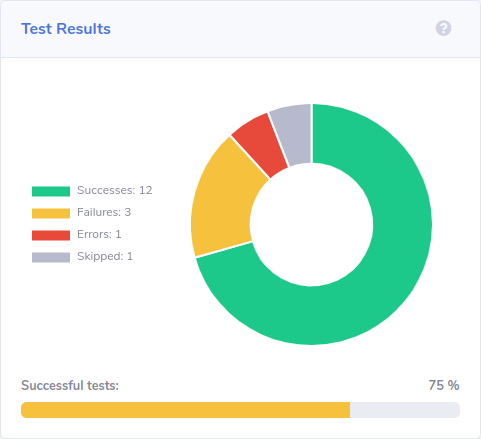
Test Results Doughnut
A test results doughnut chart is generated for the most recent test report. It gives an overview about the latest test result as well as the percentage of successful tests.
The percentage is the ratio of the successful tests to the number of total run tests, excluding skipped tests.
Test Results Doughnut
Requirements Coverage
The Dashboard also generates meaningful charts and tables for each project that tracks requirements.
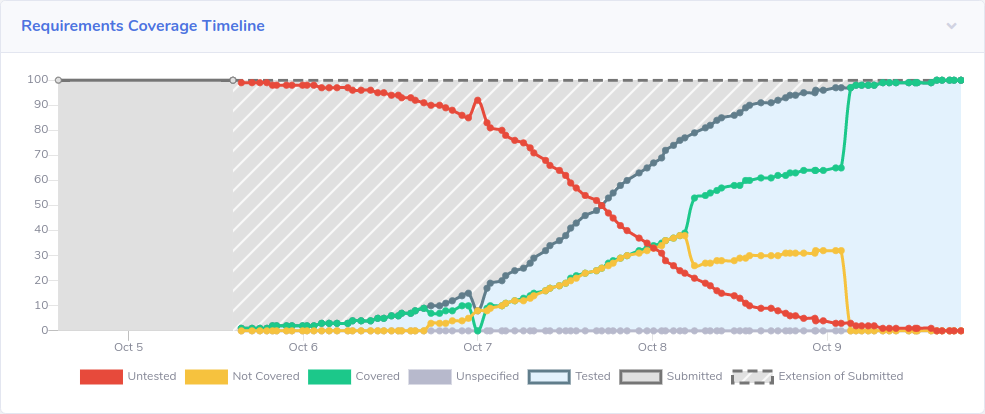
Requirements Coverage Timeline
The Requirements Coverage Timeline shows the submitted requirements over the time (gray) and the requirements coverage over the time. The latest submitted requirements are extended for a better overview (gray hatched).
Covered requirements are requirements that are submitted and tested successfully.
Not covered requirements are requirements that are submitted and have at least one failing test.
Untested requirements are submitted requirements that are not tested yet.
Unspecified requirements are requirements that are tested, but not yet submitted.
Requirements Coverage Timeline
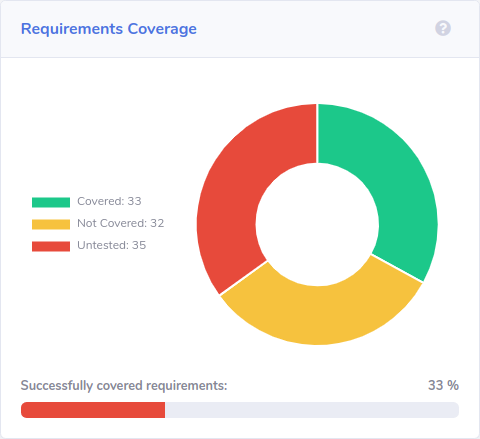
Requirements Coverage Doughnut
A requirements coverage doughnut chart is generated for the most recent test report. It shows an overview about the latest requirement coverage state, as well as the percentage of the requirements coverage.
The percentage of the requirements coverage is the ratio of covered requirements to submitted requirements.
Requirements Coverage Doughnut
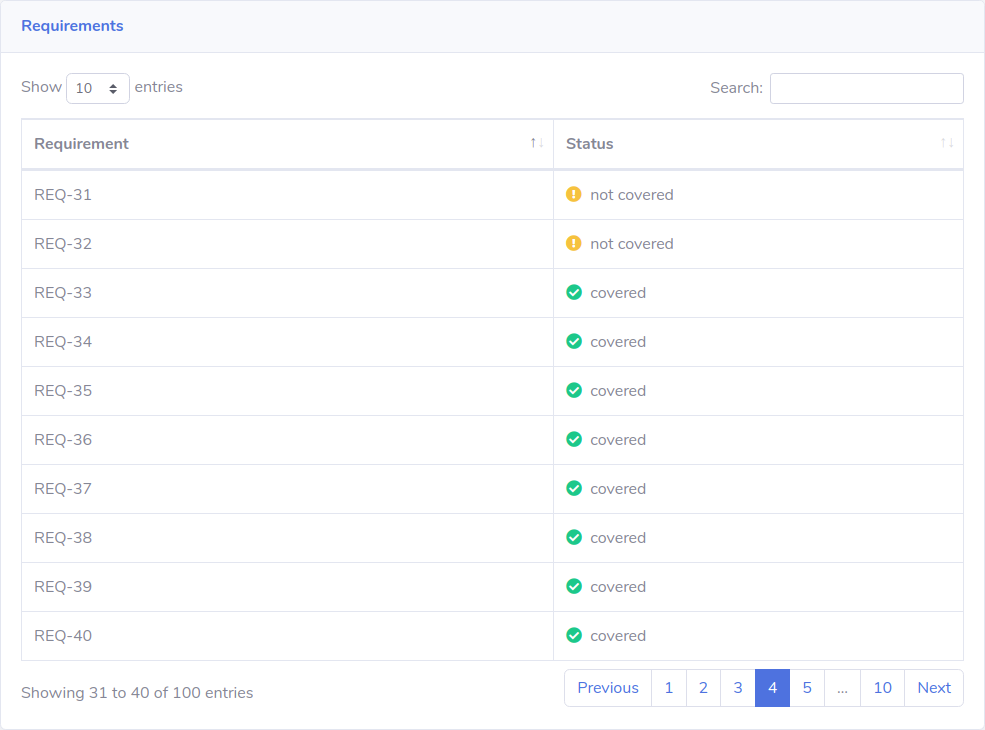
Requirements Coverage Table
The requirements coverage table shows the coverage state of all submitted and tested requirements.
Requirements Coverage Table
Badges
The Dashboard offers an easy way to visualize the status of your most recent test report as an embeddable SVG. Available badges are listed in the Badges-Submenu located in Three-Dot-Menu in the top right.
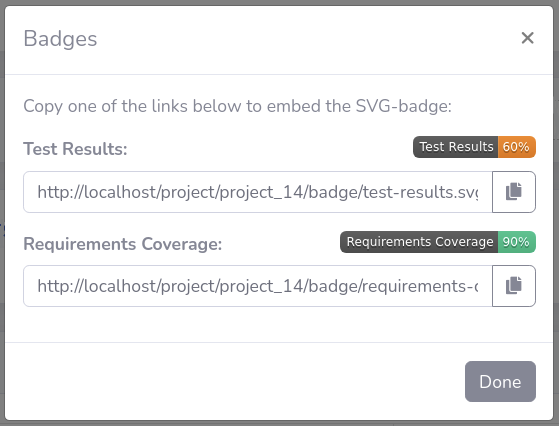
Embeddable Badges